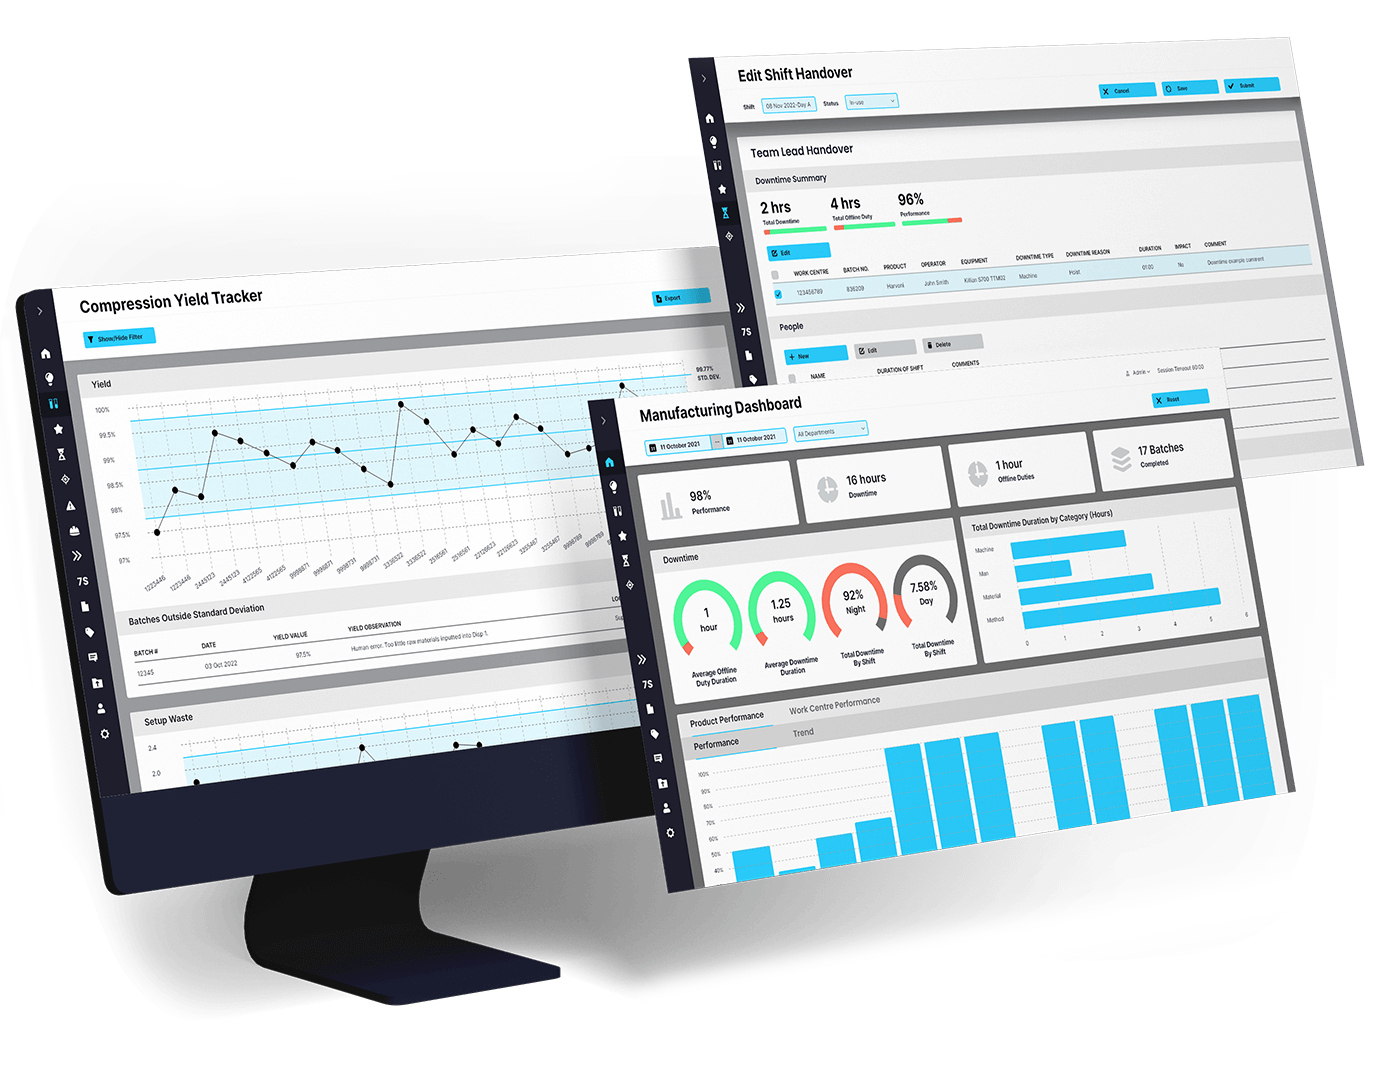
Instantly view KPI metrics, consult the Fishbone Diagram to understand downtime events and easily track the production process from start to end
Up-to-date data available when you need it and how you need it. Instant analytics are available through the dashboard and many other reporting modules as recent as the previous shift. Fed from the Digital Shift Handover module, the intelligent workflows generate instant reporting.
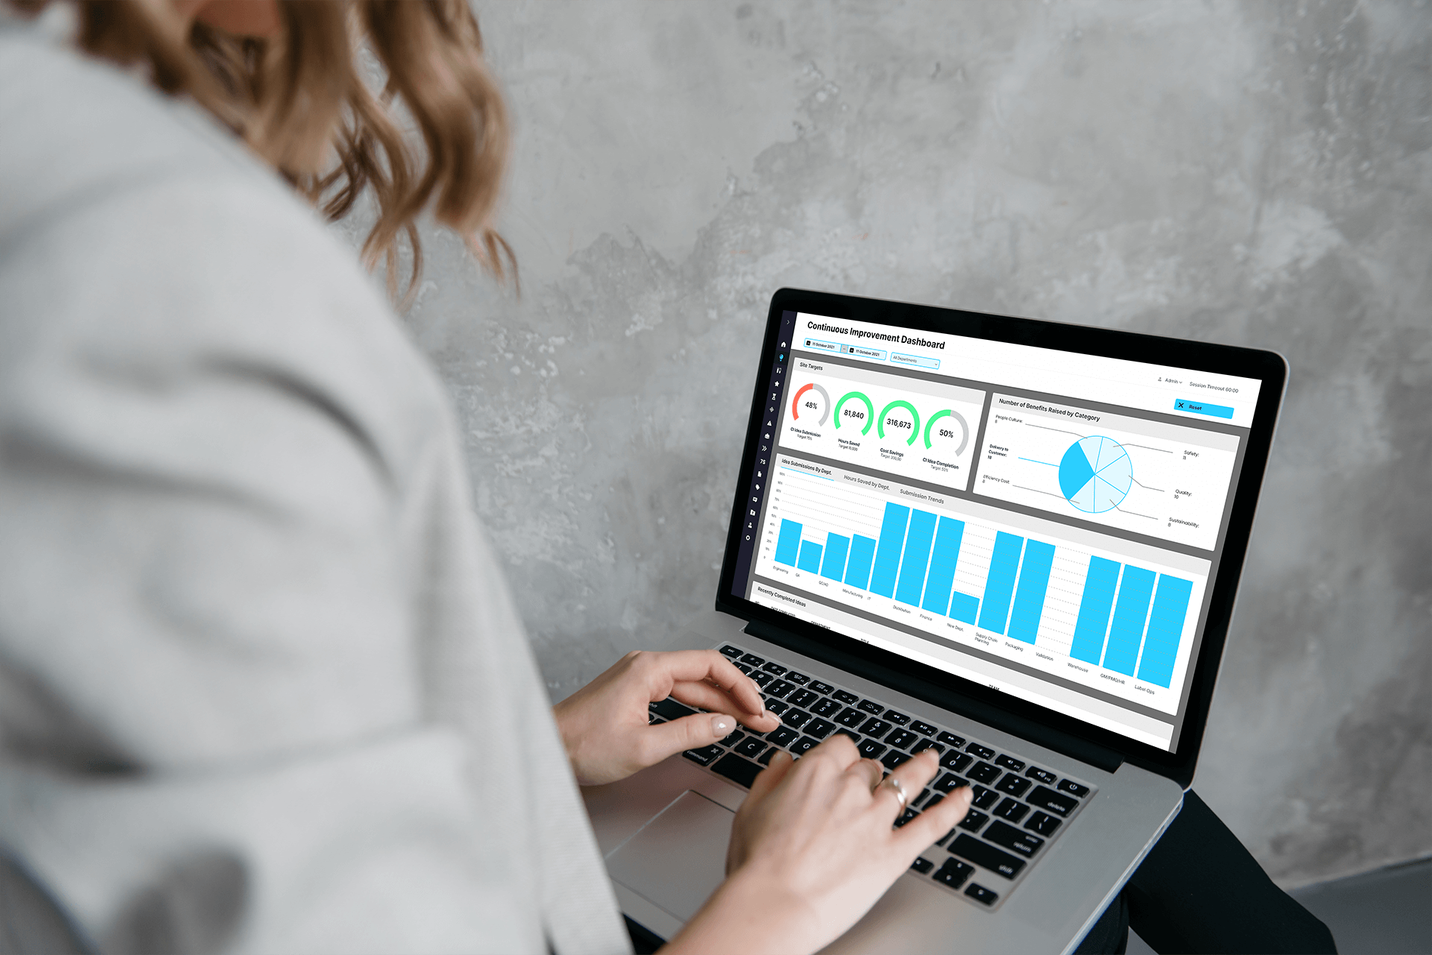
e-ConnX allows you to configure reporting the way you need it to be. Use the configuration panel to personalise downtime reasons or use predefined Fishbone and Pareto diagrams. Customise the e-ConnX platform in order to follow your manufacturing shift patterns. Easily import and export data as required.
Run instant queries across many different filters including pre-defined or custom time periods. Track each cycle (pre/during/post batch) and easily identify any possible delays in the schedule through the traffic light indicators. This downtime data automatically feeds into the Continuous Improvement modules for action tracking.
We believe in ‘what gets measured, gets managed’. Management teams rely on accurate and instantly available data in order to take informed decisions. Take a high level KPI look or dive deeper into the granular detail by simply clicking through the dashboard.
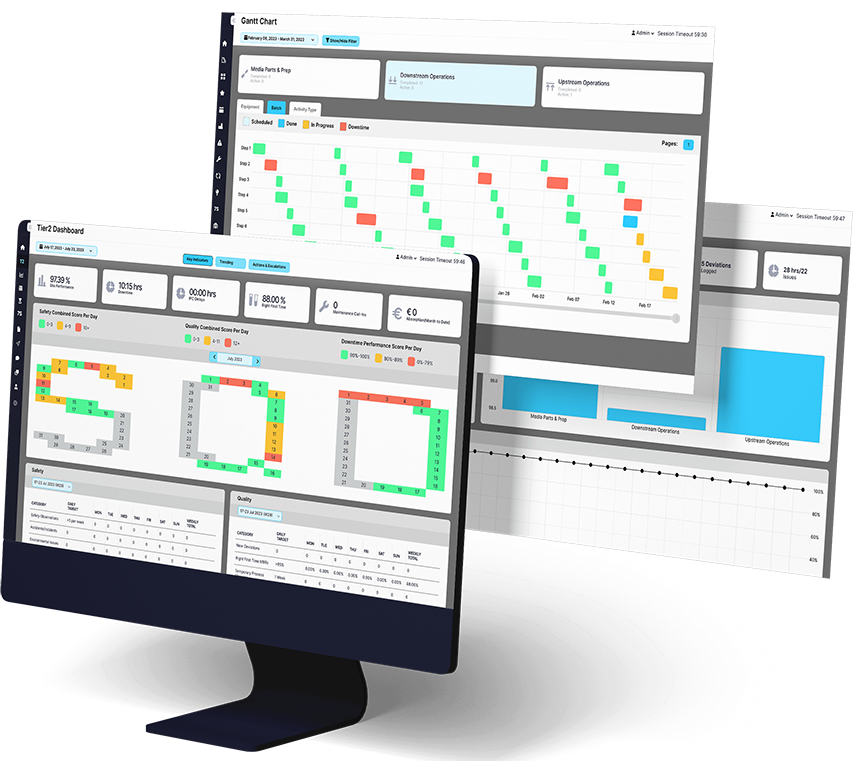
Before a batch enters the production stage there are a number of activities that need to be completed. e-ConnX helps ensure that all activities are listed by stakeholder against their respective milestones. Use of traffic lighting helps to instantly visualise what is on and off track.
e-ConnX allows any production & work centre process to be mapped out into units of Standard Work.
It is then used as a time sequence visual interface for the Operator to track adherences to the standard schedule.
Items to consider for post-batch release like quality checks, packaging and shipping can be simply charted and monitored to support a seamless operations flow. Similar to the pre-batch tracker, traffic lighting helps to instantly visualise what is on and off track.
• Tier 1 reporting with high-level KPI Dashboards
• Instantly interrogate the analytics through granular reporting
• Easily see issues and actions being tracked on the floor in real time
• Key information provided through automated daily emails
• Instant view of all previous shift events
• Can identify the true scale and cause of downtime through readily available analytics
• Shift priority tasks can be easily assigned and tracked
• A3/Root Cause Analysis at a glance for QA teams
• Both teams benefit from inter-departmental communication with production
• Clear visibility on where the previous shift ended and outstanding tasks
• Data is captured on one single tool that replaces multiple reporting systems
• Can log Continuous Improvement Ideas directly in the Shift Handover
This is a very straightforward deployment. EviView will do 95% of the heavy lifting by taking an AGILE approach to the project.
After requirements are gathered, brief periodic feedback and consultation sessions are all that’s required with the key project stakeholders.
(Approx. 6 weeks)
(Approx. 10 weeks)
(Approx. 1 week)
(Approx. 1 week)
Give your manufacturing team the right tool for data collection and analysis.
Start with an incremental change today by booking a demo.
Our clients often describe the the software a ‘Virtual Work Centre’ given the sheer number of functionalities it offers.
Seamless transfer of information from outgoing to incoming shift teams
Get a high-level overview or deep dive into the granular detail
We adhere to the strictest IT security requirements expected by your business
Easily search the system for any historical data
Automatically extract and represent data from your ERP, Historian, QMS etc.
Taking an agile approach to development, you can go-live in just 18 weeks
Relevant reporting is automatically emailed to respective tiers
Different departments can easily communicate with each other through e-ConnX
e-ConnX is available in multi-lingual options that can be switched instantly
Our intuitive software interface is designed to suit devices of any type and size
Our software links factory floor teams to manufacturing KPI’s
Clear visibility of all tasks by owner, priority and status across all modules
Complementary to our Manufacturing Analytics, we have additional modules to digitalise, standardise & integrate shift handover reporting along with CI, RCA & Equipment Reliability Trackers.
Karl Nolan
VP – Business Development
knolan@eviview.com
Call Karl today to get the conversation going:
Office: +353 (0)21 242 7026
If you don’t like filling up forms, just email us!
We use cookies and similar methods to activate the live chat feature, recognize visitors, and remember their preferences. We also use them to measure ad campaign effectiveness, target ads and analyze site traffic. To learn more, view our Cookie Policy. Read More
Name | Domain | Purpose | Expiry | Type |
---|---|---|---|---|
wpl_user_preference | eviview.com | WP GDPR Cookie Consent Preferences | 1 year | HTTP |
Name | Domain | Purpose | Expiry | Type |
---|---|---|---|---|
_ga | eviview.com | Google Universal Analytics long-time unique user tracking identifier. | 2 years | HTTP |
_gid | eviview.com | Google Universal Analytics short-time unique user tracking identifier. | 1 days | HTTP |
Name | Domain | Purpose | Expiry | Type |
---|---|---|---|---|
_gat_gtag_UA_99166093_1 | eviview.com | --- | Session | --- |
No robots. No automated emails. We will personally get in touch and work around your availability!
If you don’t like filling up forms just email us!
VP - Business Development
knolan@eviview.com
Office: +353 (0)21 242 7026