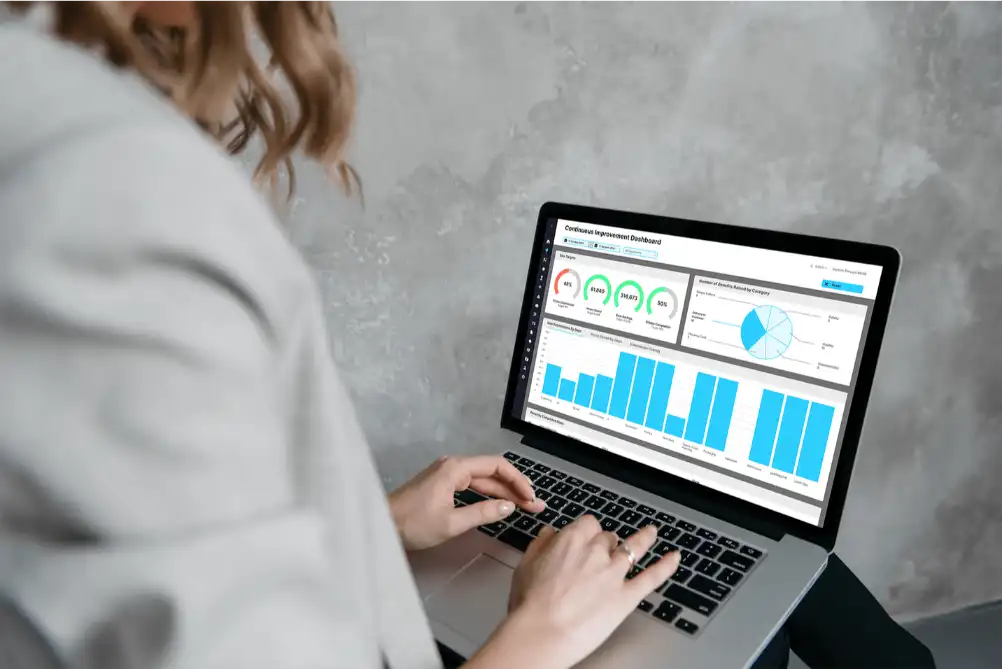
Manufacturing Analytics
Instantly view KPI metrics, consult the Fishbone Diagram to understand downtime events, and easily track the production process from start to end.

Actionable Insights at Your Fingertips
On-Demand Reporting
Up-to-date data is always available when and how you need it. EviView’s intuitive dashboards and reporting modules provide instant analytics, powered by workflows from the Digital Shift Handover module. These features ensure real-time insights, making EviView a trusted manufacturing analytics solution for operational excellence.
Flexibility
EviView’s manufacturing analytics adapts to your needs. Configure reports to fit your unique operations, personalise downtime reasons, or leverage tools like Fishbone and Pareto diagrams. Import and export data effortlessly while ensuring alignment with your manufacturing shift patterns.
Visibility
Instantly query data across various filters and time periods. Track every production cycle-pre, during, and post batch-with intuitive traffic light indicators. This downtime data seamlessly integrates into the Continuous Improvement modules for action tracking, ensuring greater visibility into your processes.
Collaboration & Communication
EviView promotes a data-driven culture by centralising access to production information. The platform bridges gaps between engineering, operations, and maintenance teams, encouraging collaboration and enabling faster problem-solving. With its manufacturing analytics solution, EviView empowers organisations to drive efficiency and improve overall production performance.
Streamline Production with EviView's Visual Interface
Performance Analytics
We believe that what gets measured gets managed. Management teams rely on accurate and instantly accessible data to make informed decisions. With EviView’s manufacturing analytics, you can take a high-level look at your KPIs or dive into granular details using the interactive dashboard.
- Dashboards featuring built-in site KPIs
- Pareto and Fishbone Charts for detailed downtime analysis
- Clear visibility into recurring issues, sorted by frequency and total hours lost
- Quick insights: View your site’s performance within 30 seconds

Standard Work Tracker
EviView’s manufacturing analytics enables production and work centre processes to be mapped into units of standard work. This visual, time-sequence interface helps operators stay on schedule while simplifying reporting.
- Processes integrate seamlessly into the shift handover, allowing operators to log reports at the end of shifts
- Variances from the ideal schedule can be captured through a simple drop-down and comment
- Intelligent workflows remove repetitive data entry, focusing on critical information
Pre- and Post-Batch Tracker
Post-batch release activities, such as quality checks, packaging, and shipping, can be easily charted and monitored to ensure a seamless operations flow. Similar to the pre-batch tracker, traffic lighting provides instant visualisation of what’s on track and what requires attention.
- Monitor the final release of each batch effortlessly
- Ensure tasks across different functions are completed on time
- Log and store details of any missed milestone deadlines for better accountability
Manufacturing Analytics
Turning real-time production data into clear insights that drive performance, solve problems, and support continuous improvement.


How Site Stakeholders Benefit
Site Leader
- Gain a high-level overview with Tier 1 reporting through an intuitive KPI dashboard
- Dive into granular analytics to instantly interrogate key metrics
- Monitor issues and actions in real time directly from the production floor
- Stay informed with automated daily emails delivering critical updates

Manager/Supervisor
- Access a clear and instant view of all previous shift events
- Identify the root cause and full scope of downtime with detailed analytics
- Easily assign and track priority tasks to maintain operational efficiency


Take the First Step
Explore how EviView can support your team – from shift handovers to full compliance tracking.