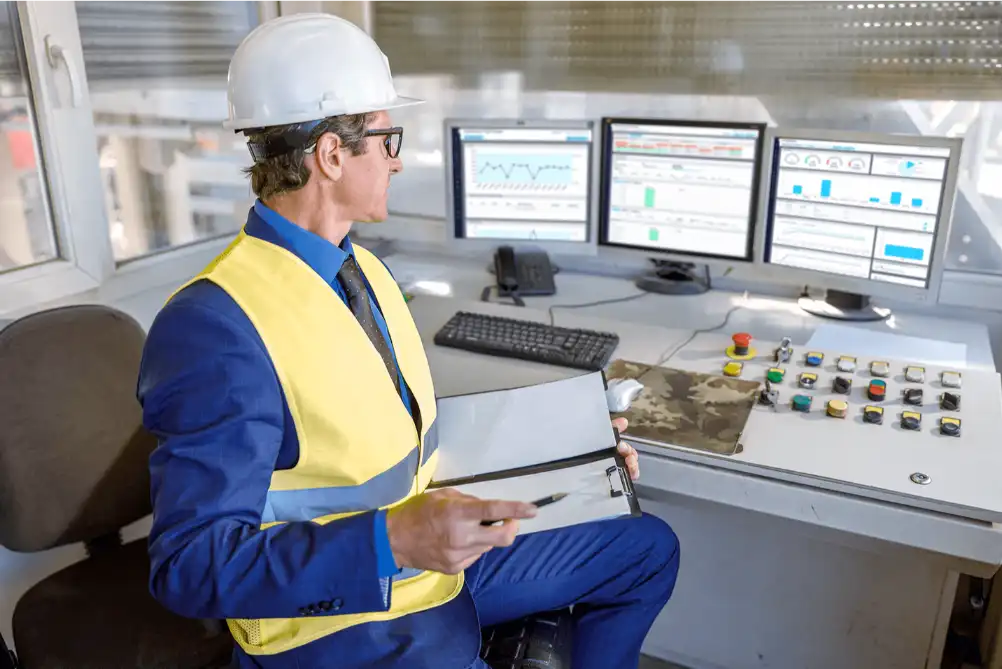
Root Cause Analysis
Stop wasting time and resources on reactive solutions. EviView’s RCA software empowers you to uncover the root causes of operational headaches, preventing them from disrupting your production in the future.

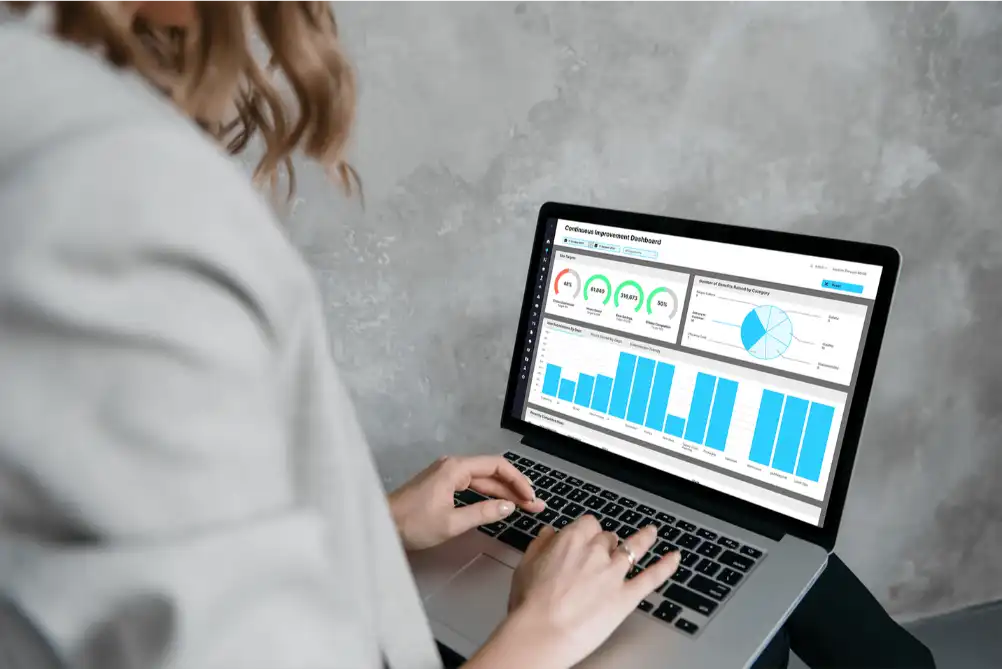
Get More Accurate Answers with Richer Data

The A3 Approach
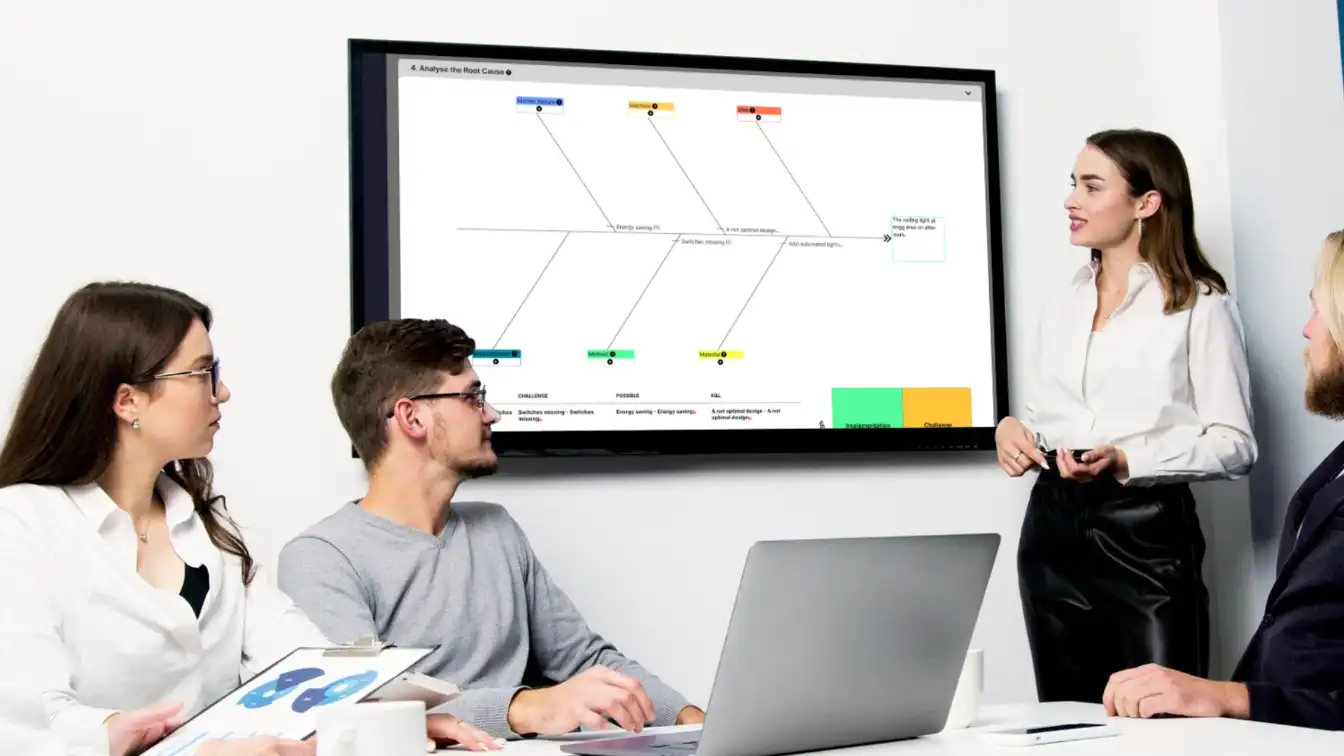
With tools like the Fishbone Diagram, EviView’s RCA software helps you visually map problems and analyze data to efficiently pinpoint root causes and develop lasting solutions.

See the Bigger Picture
EviView’s RCA software leverages the Ishikawa diagram to give you a clear, comprehensive perspective on potential causes. Systematically break down issues to identify root causes and take decisive action.

Achieve Lasting Solutions
Strong record control in our RCA software enables you to identify root causes and avoid focusing only on symptoms. Captured data ensures solutions are effective and prevent problems from recurring.
Root Cause Analysis (RCA)
From first sign to final fix, get to the root faster with guided problem-solving and collaborative analysis tools.


Crack the Code: Empower Faster Problem-Solving
Digitizing your RCA/A3 forms not only minimizes your company’s environmental impact but also empowers you to solve problems quicker. EviView provides a robust suite of tools that guide you through every step of the RCA/A3 process:
- Clearly define the problem with ease
- Systematically identify potential root causes
- Pinpoint the primary and secondary culprits with precision
- Develop a clear and actionable plan for remediation
Streamline Your
Root Cause Analysis Process
On-Demand Reporting
Up-to-date data is available when you need it and how you need it with EviView’s RCA software. Instant analytics are accessible through the dashboard and various reporting modules, offering insights as recent as the previous shift. Integrated with the Digital Shift Handover module, the intelligent workflows generate instant reports for effective root cause analysis.

Flexibility
EviView allows you to configure reporting the way you need it to be. Use the configuration panel to personalize downtime reasons or use predefined Fishbone and Pareto diagrams. Customize the EviView platform in order to follow your manufacturing shift patterns. Easily import and export data as required.
Gain Full Visibility
Run instant queries across many different filters, including pre-defined or custom time periods. Track each cycle (pre, during, and post batch) and easily identify any possible delays in the schedule through the traffic light indicators. This downtime data automatically feeds into the Continuous Improvement modules for action tracking.
Collaboration & Communication
EviView’s RCA software fosters a data-driven culture within your organization. By providing a centralized platform for accessing and analyzing production data, it bridges the gap between departments. Engineering, operations, and maintenance teams can collaborate seamlessly, enabling faster problem-solving and improved overall production efficiency.
Streamline Production with EviView's Visual Interface
Performance Analytics
We believe that what gets measured gets managed. Management teams rely on accurate and instantly accessible data to make informed decisions. With EviView’s manufacturing analytics, you can take a high-level look at your KPIs or dive into granular details using the interactive dashboard.
- Dashboards featuring built-in site KPIs
- Pareto and Fishbone Charts for detailed downtime analysis
- Clear visibility into recurring issues, sorted by frequency and total hours lost
- Quick insights: View your site’s performance within 30 seconds

Standard Work Tracker
EviView’s manufacturing analytics enables production and work centre processes to be mapped into units of standard work. This visual, time-sequence interface helps operators stay on schedule while simplifying reporting.
- Processes integrate seamlessly into the shift handover, allowing operators to log reports at the end of shifts
- Variances from the ideal schedule can be captured through a simple drop-down and comment
- Intelligent workflows remove repetitive data entry, focusing on critical information
Pre- and Post-Batch Tracker
Post-batch release activities, such as quality checks, packaging, and shipping, can be easily charted and monitored to ensure a seamless operations flow. Similar to the pre-batch tracker, traffic lighting provides instant visualisation of what’s on track and what requires attention.
- Monitor the final release of each batch effortlessly
- Ensure tasks across different functions are completed on time
- Log and store details of any missed milestone deadlines for better accountability
Used by Global Leaders


Let's Talk Digital Operations!
Explore how EviView can support your team – from shift handovers to full compliance tracking.