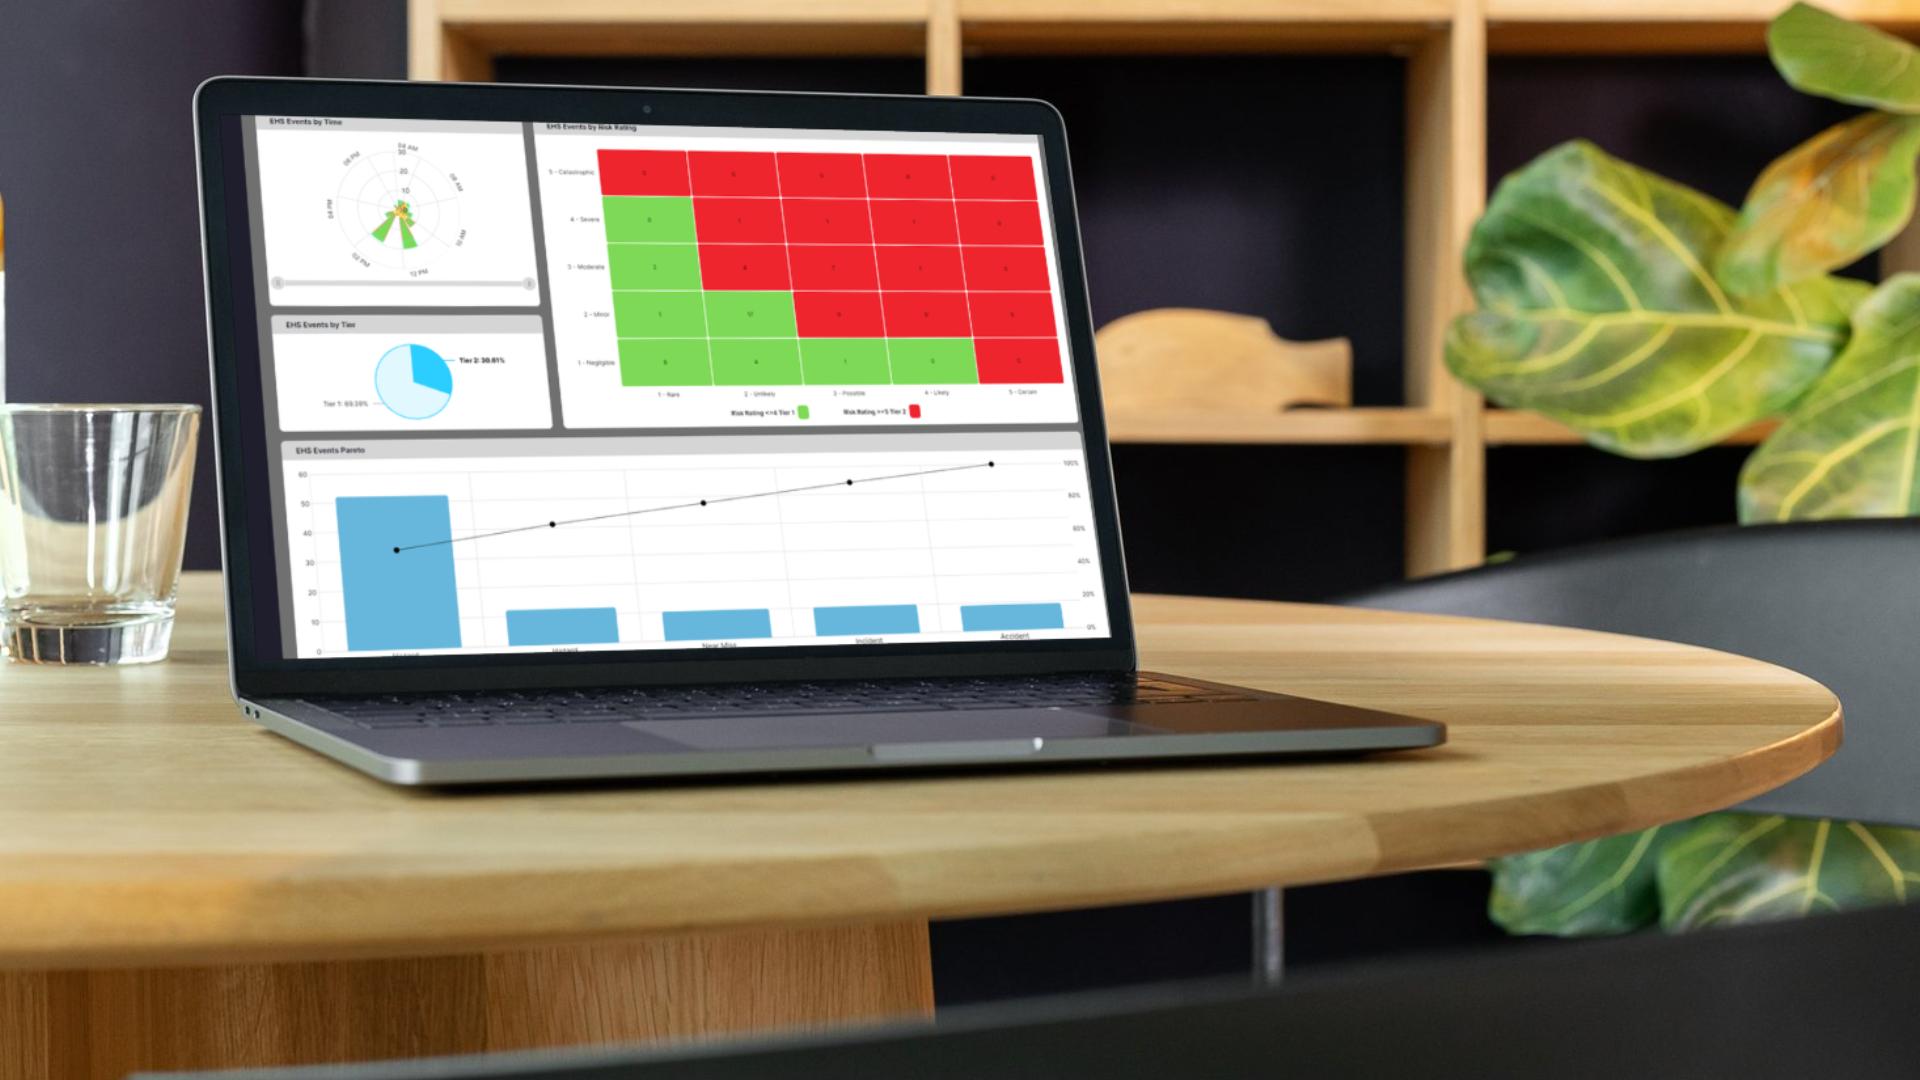
When every issue feels urgent, teams waste time chasing symptoms instead of solving root causes. EviView’s built-in Pareto charts bring clarity to your data, showing exactly which problems are having the biggest impact on operations so your team knows where to act first.
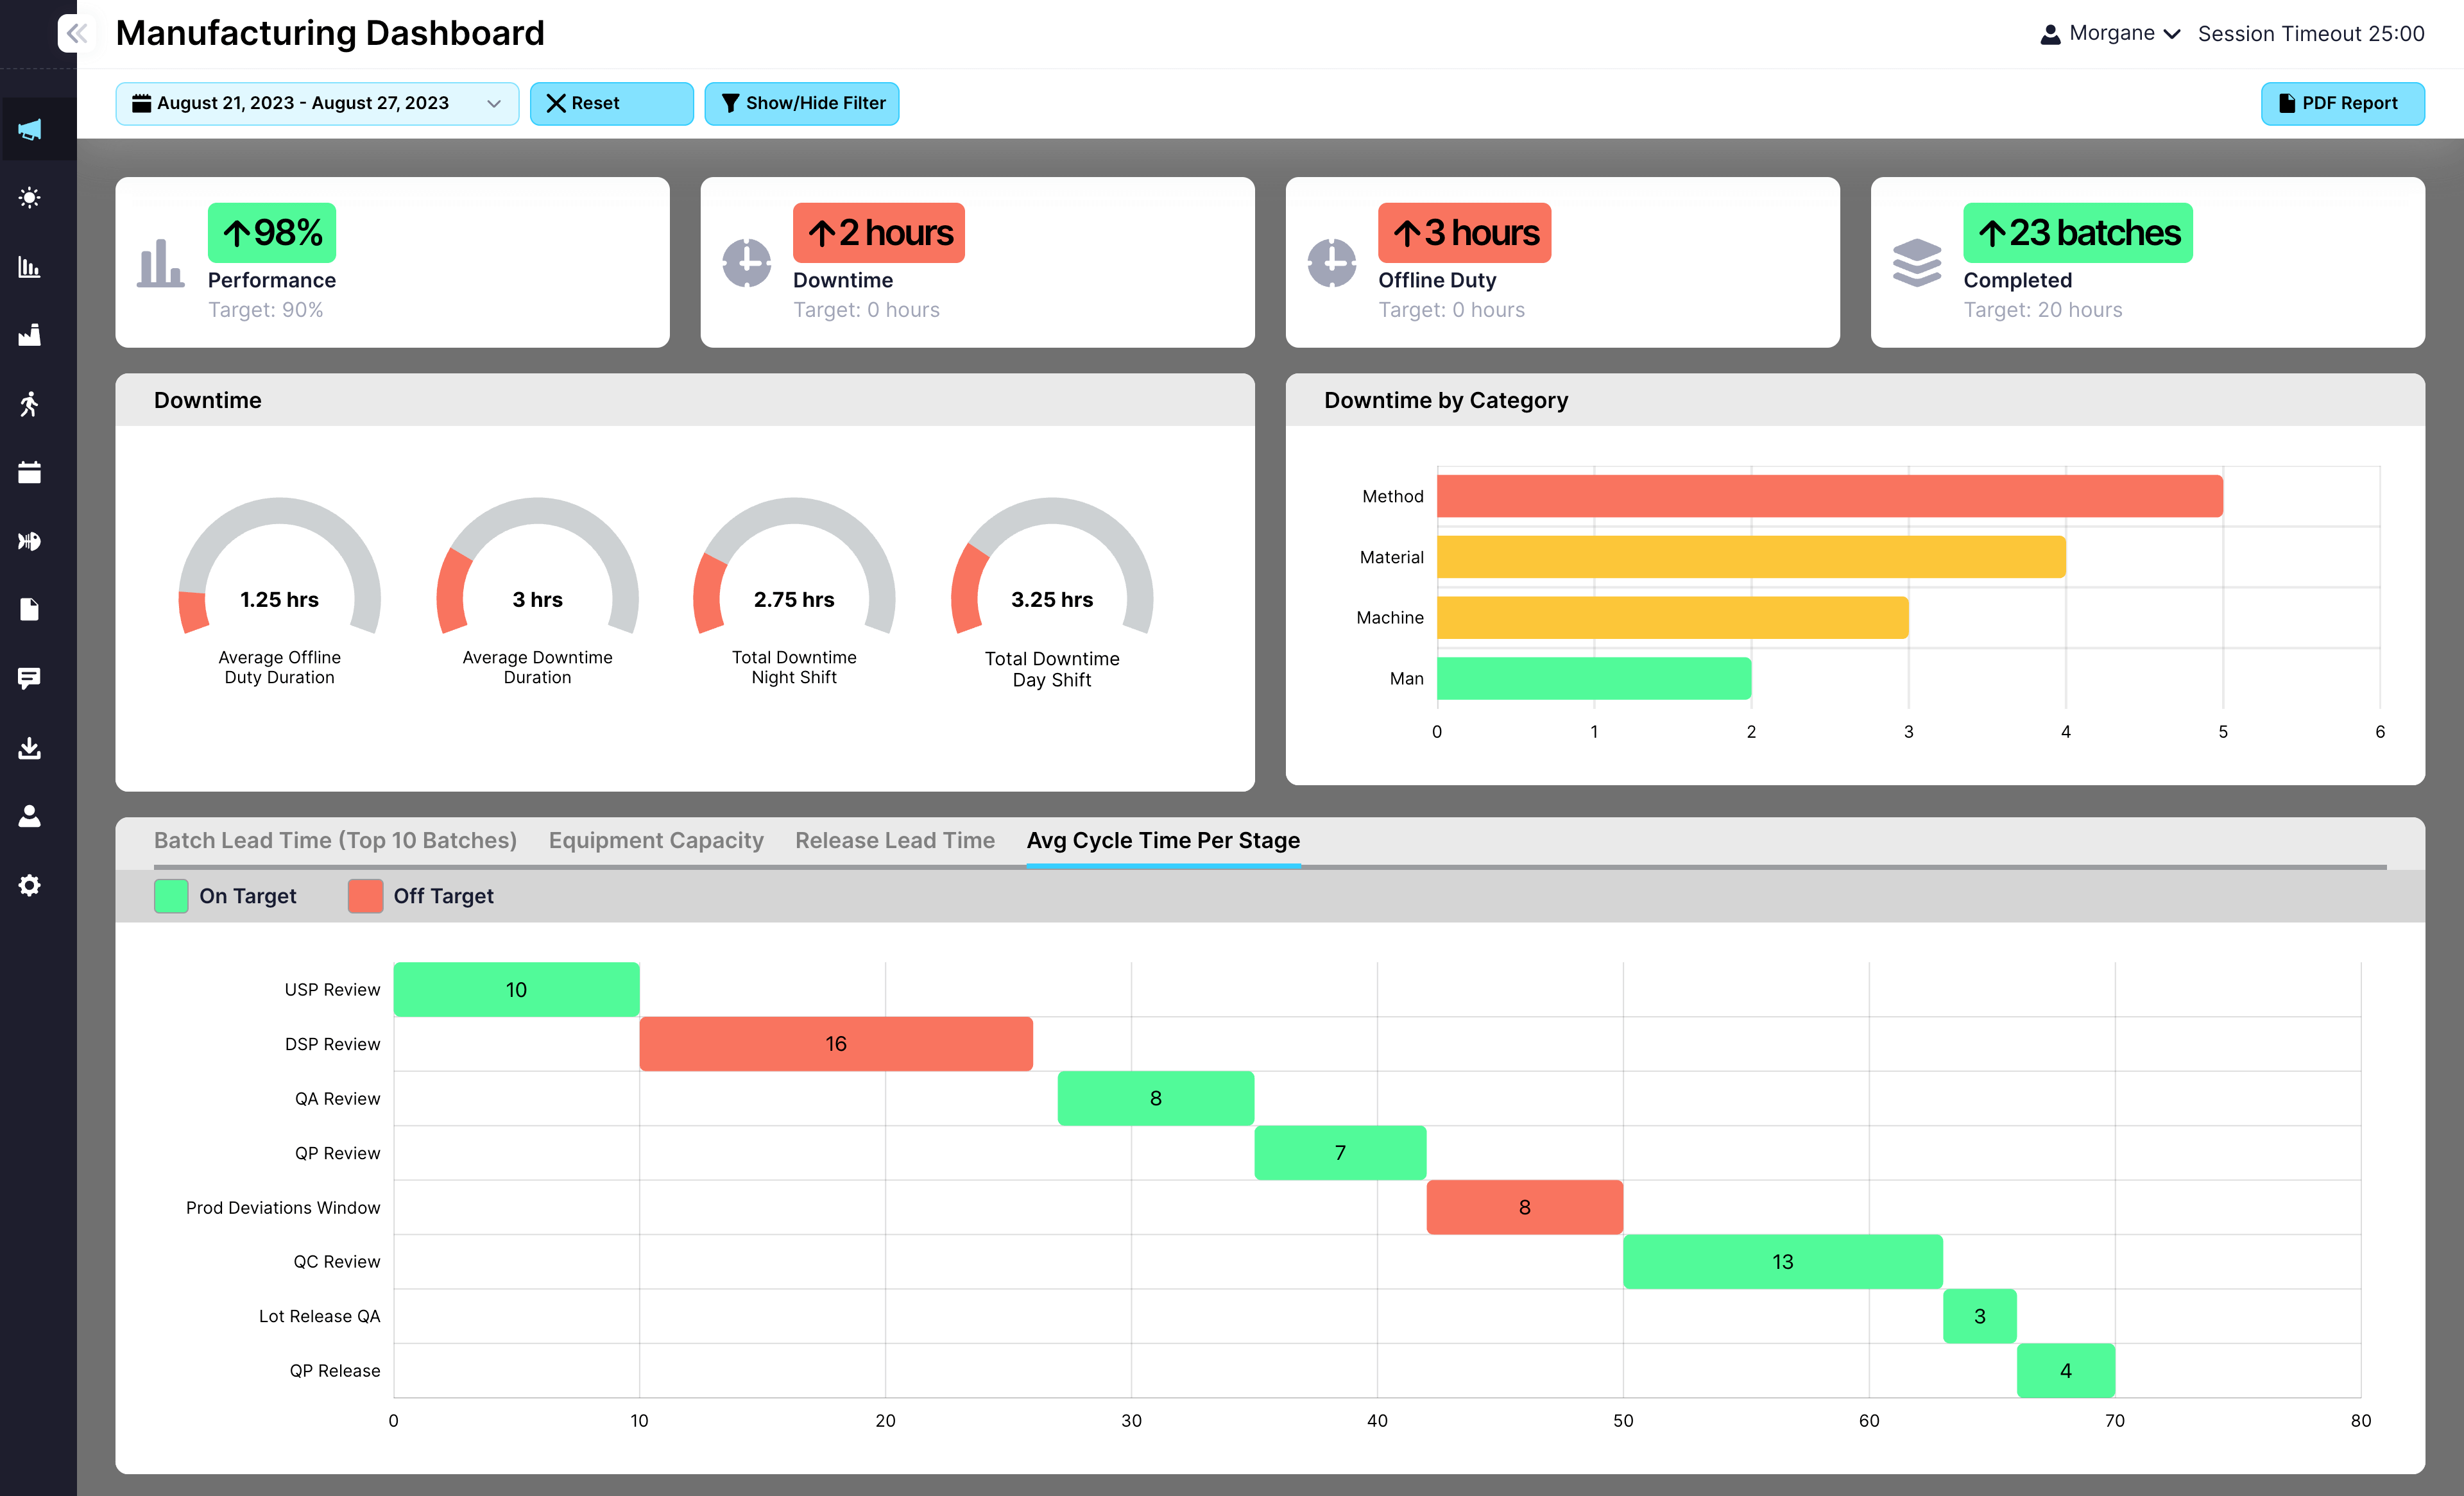
Request a DemoPareto charts help teams stop guessing and start prioritizing. In EviView, they’re built directly into your shift data and dashboards, so you can visualize top contributors to downtime, quality issues, or delays in real time.
Highlight the most common failure modes, blockers, or delays
Visualize frequency vs. impact to guide decision-making
Filter by line, department, date, or shift for sharper insights
Track changes over time to validate improvements

Unlike static Excel charts or generic dashboards, EviView’s Pareto tools are connected directly to shift activity. That means the insights are real-time, grounded in operational context, and ready to act on, not just analyze.
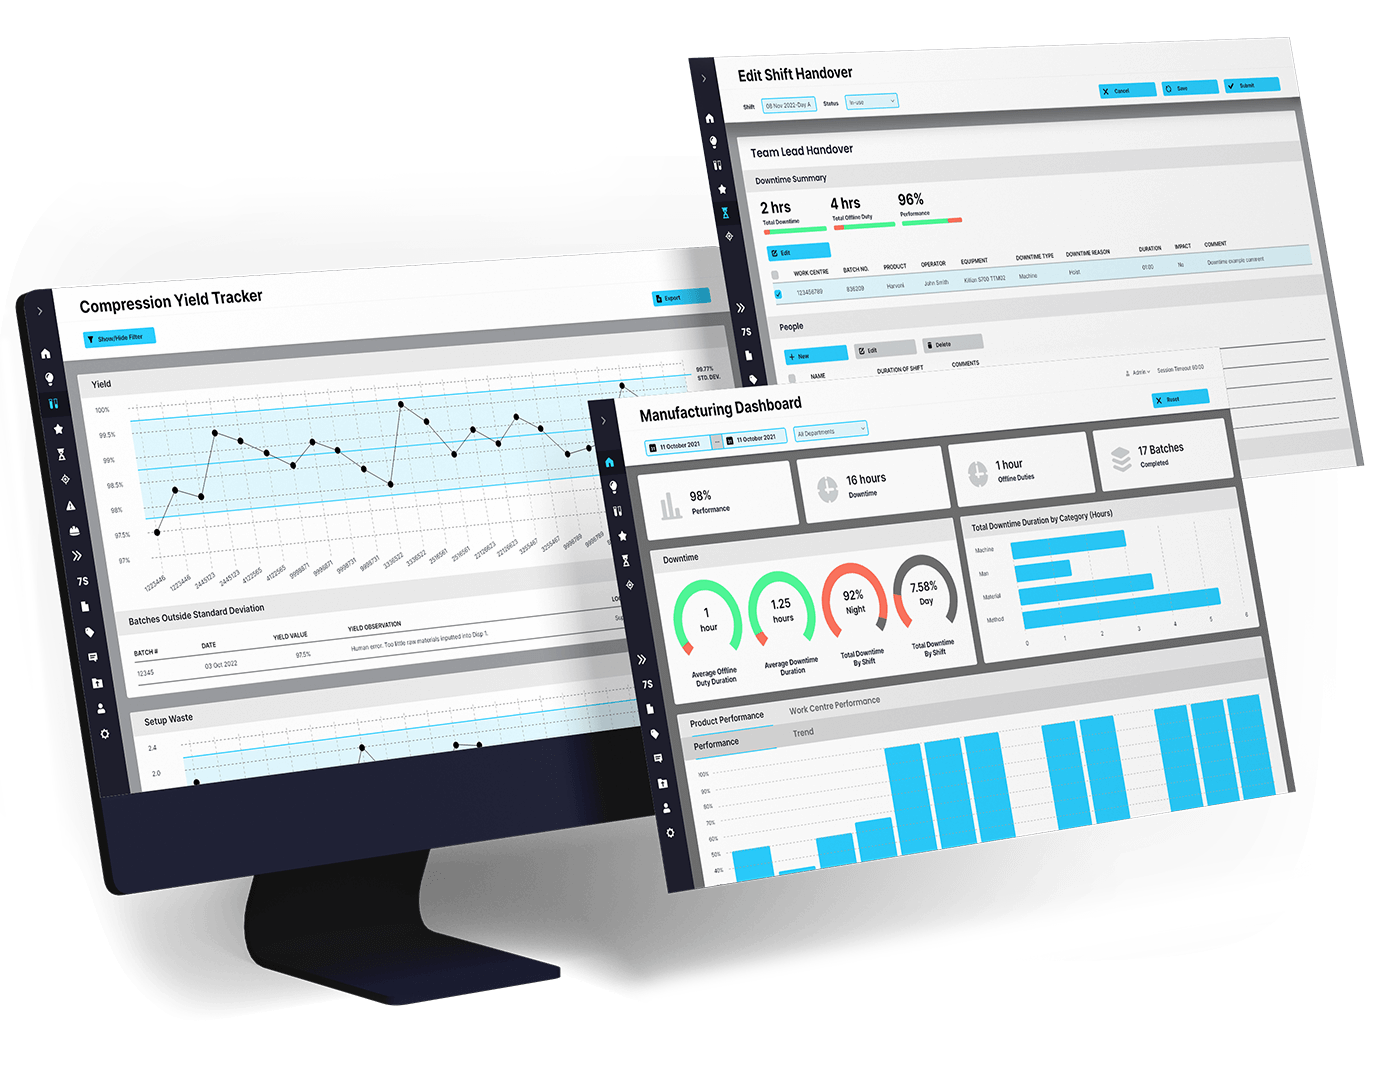
Whether tied to production, maintenance, or quality, Pareto charts in EviView align with your MES, QMS, and ERP systems for smarter decision-making at every level.
Request a Demo
Operations, quality, and CI teams across industries rely on EviView’s Pareto charts to identify patterns, prioritize projects, and accelerate problem-solving. Here’s how real teams are using them to focus efforts and close the gaps that matter most.

EviView’s Digital Daily Management System has been transformative for Merck. By streamlining shift handovers, centralizing data, and integrating with SAP and Palantir Data Lake, we’ve reduced downtime by 30% and saved €66,000 annually. The system has boosted visibility, improved communication, and increased safety incident reporting by 300%, fostering a culture of continuous improvement and positioning us for long-term success.

Pharmaceutical Company, US
Head of Digitalisation and Strategy
I worked with EviView on an electronic handover project. Their team was very knowledgeable, took time to ensure all stakeholders were kept up to date with the progress of the project, and was always available to give advice on system usage during implementation.
Bio-Pharma Company, US
Manufacturing Team Lead
Karol's team delivered a highly successful change management and digital transformation project. His structured approach, detailed analysis, and process-driven methodology have been invaluable on every project. EviView's understanding of business, IT, operations, and budgetary needs is unmatched.
Top 5 Pharma Manufacturer, EU
Senior Manager of Engineering & Maintenance
A chart is only useful if it leads to action. In EviView, every insight from your Pareto chart can trigger follow-up tasks, highlight missed steps, or feed into continuous improvement workflows. Pareto isn’t just for reporting anymore — it’s part of how your plant operates.