
360 Dashboards for Complete Operational Visibility
EviView puts the power of data in everyone’s hands. Available on-premise or in the cloud, deliver real-time insights to your entire team. No more waiting for reports – with EviView’s 360 dashboards, your data is always fresh and actionable.

Take Control with Real-Time Monitoring and Data-Driven Dashboards

Drive Performance
Turn insights into action. Real-time, accurate operational data helps you optimize uptime, yield, quality, efficiency, safety, and sustainability.

Proactively Mitigate Risks and Bottlenecks
Predict potential issues, identify root causes, and recommend solutions to minimize operational risks.

Empower Smarter Decision-Making
Centralize data, visualize insights, get alerts, and track decisions – all in one flexible platform.
A Complete Suite of Features to Meet All Your Operational Needs
On-Demand Reporting
- Up-to-date data is available when you need it and how you need it. Instant analytics are available through the dashboard and many other reporting modules as recent as the previous shift. Fed from the Digital Shift Handover module, the intelligent workflows generate instant reporting.

Flexibility
EviView allows you to configure reporting the way you need it to be. Use the configuration panel to personalize downtime reasons or use predefined Fishbone and Pareto diagrams. Customize the EviView platform in order to follow your manufacturing shift patterns. Easily import and export data as required.
Visibilty
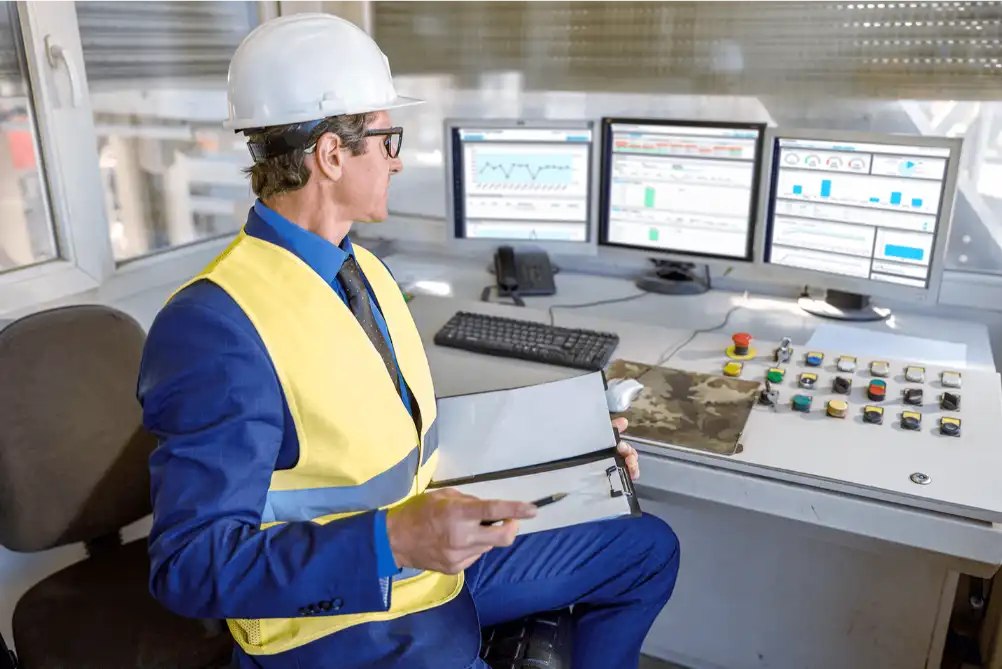
Run instant queries across many different filters, including pre-defined or custom time periods. Track each cycle (pre, during, and post batch) and easily identify any possible delays in the schedule through the traffic light indicators. This downtime data automatically feeds into the Continuous Improvement modules for action tracking.
Collaboration & Communication
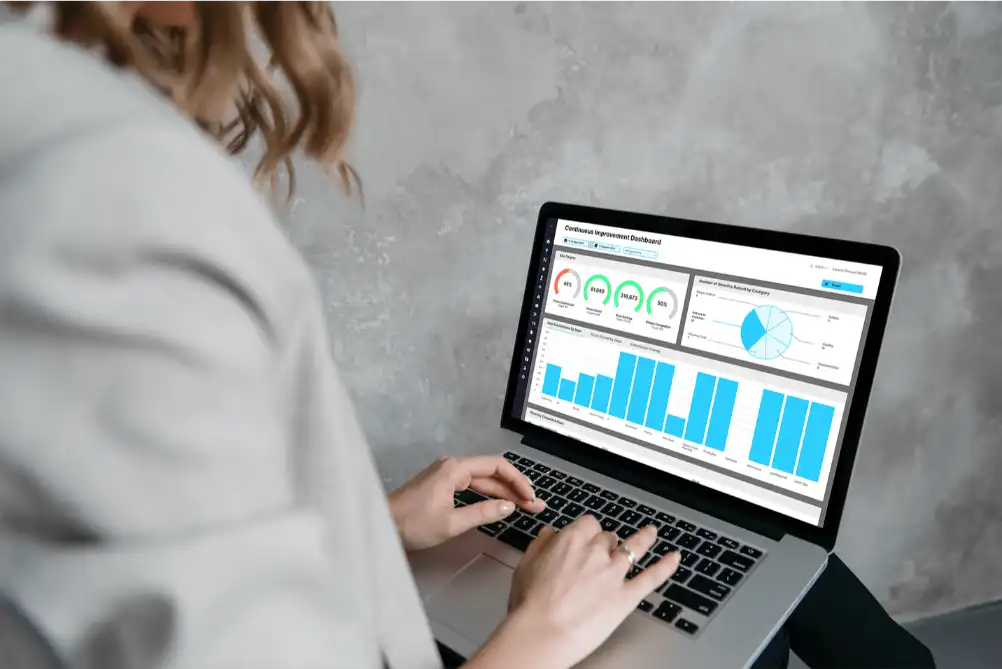
EviView fosters a data-driven culture within your organization. By providing a centralized platform for accessing and analyzing production data, EviView bridges the gap between different departments. Engineering, operations, and maintenance teams can collaborate more effectively, leading to faster problem-solving and improved overall production efficiency.
Get More Accurate Answers with Richer Data
See the Bigger Picture
Using the Ishikawa diagram, you'll gain a comprehensive perspective on potential causes. By systematically dissecting the issue, you can pinpoint the root and take decisive action to prevent future occurrences.
The Power of 5 Whys
Go beyond surface solutions and uncover the real culprit! This structured questioning technique employs a relentless series of "whys" to delve deeper and pinpoint the root cause of any problem.
Drive Continuous Improvement
Leveraging CAPA, hold the root cause accountable ! Assign ownership for implementing corrective and preventive actions, ensuring the problem is truly eradicated.
No More Repeat Issues
Strong record control helps you identify the root cause of issues, not just treat the symptoms. By capturing crucial data, you can implement solutions that ensure problems don't resurface.
How Site Stakeholders Benefit
Operator
- Clear visibility on information from the previous shift and outstanding tasks
- One single tool that replaces multiple reporting systems.
- Log continuous improvement ideas directly in the digital shift handover to drive efficiency site-wide.

Site Leader
- Adopt the SQDIP approach
- Clear visibility of executed and outstanding actions
- Effective process tracking through intelligent workflows
- Capture any variations from the standard production process

Manager/Supervisor
- In a single window, see where the production process is compared to the schedule.
- Identify the true scale and cause of downtime through readily available analytics.
- Shift priority tasks can be easily assigned and tracked.
- Instant view of all previous shift events.

QC/Maintenance
- A3/Root Cause Analysis at a glance for QA teams.
- Both teams benefit from inter-departmental communication with production.
- Potential failures can be predicted, preventing unplanned downtime and reducing maintenance costs.












Why Choose EviView?
Expertise
On a daily basis, EviView works with global blue-chip companies across pharma, bio & chemical industries. As these industries constantly evolve, anticipating requirement changes is what drives EviView’s innovation agenda.
System Customisation
The system design starts out with replicating and enhancing the client’s existing approach to shift handover with the intention to replace all existing Excel files and trackers. EviView recognises the importance of keeping things simple from the outset.
Modular by Design
As the application is modular in structure, it can evolve and change as the business does. The development team ensures that the delivered solution is no more, or no less, than what the client needs, when they need it.
Customer-Centric
EviView is not a consultancy-oriented business. Huge emphasis goes into allowing the client to directly configure the application with or without support. This is why EviView ensures that the client administrators have full configuration capabilities.
Security
EviView has been through the most rigorous security assessments led by its blue chip client base. A single-tenant VPC, is made accessible to the Client. User authentication is managed using the Client’s SSO over SAML.
Support
EviView conducts business across the globe, spanning from the US west coast (-9 hrs) to India (+5.5 hrs). Every customer has a dedicated Account Manager and the reassurance of the highest standard of service protected by a Service Level Agreement.
Other Modules
Complementary to our 360 Dashboards, we have additional modules to digitalize, standardize, and integrate shift handover reporting along with Continuous Improvment, Shift Handover, and Equipment Manufacturing Analytics.
Digital Shift Handover
Give your teams a single, easy-to-use digital shift handover tool that allows them to seamlessly communicate shift events.
- Adopt the SQDIP approach (i.e., safety, quality, delivery, inventory, and productivity)
- Clear visibility of completed and outstanding actions
- Effective process tracking through intelligent workflows
- Capture any variations from the standard production process at the end of the shift
Continuous Improvement
Focus on increasing operating efficiency and reducing costs and downtime by providing a tool that supports a culture of change.
- Make it easy for operators to log continuous improvement ideas during shift handover
- Using Pareto’s chart and the Fishbone diagram to drive production process improvements
- Establish, action, and track all root cause analysis and problem solving A3s in one software
Manufacturing Analytics
Instantly view KPI metrics, effortlessly analyze downtime events using the Fishbone Diagram, and seamlessly monitor the entire production process from start to finish.
- Dashboard with granular reporting on demand or on click
- Pre, during, and post batch tracking to visualize what is on and off track
- Run instant queries across many different filters, including pre-defined or custom time periods
Let's Talk Digital Operations!
Explore how EviView can support your team – from shift handovers to full compliance tracking.