EviView helps teams build and use Fishbone Diagrams as part of structured, step-based problem solving. Contributing factors are mapped visually, analyzed collaboratively, and linked to tasks that drive closure. It’s RCA that moves from the boardroom to the production floor—with full visibility and follow-through.
Request a DemoFishbone Diagrams in EviView aren't static charts—they’re connected to real RCA workflows. Teams capture potential causes under categories like method, machine, material, or people, then investigate, assign, and resolve—all from one platform.
Build cause-and-effect diagrams with real-time collaboration
Organize causes by standard RCA categories
Link causes to corrective actions and owners
Assign root causes to owners and track resolution status in real time.

Fishbone Diagrams in EviView are part of the Root Cause Analysis suite—fully integrated with 8-step problem solving, escalation workflows, and CI reporting. Teams collaborate live, assign tasks directly from the cause tree, and leadership tracks closure across locations. Each contributing factor is linked to action, ownership, and supporting data—so investigations stay active, not abstract. Whether you're solving production deviations, quality issues, or audit findings, fishbone diagrams guide teams through resolution, not just analysis.
Request a Demo
In EviView, Fishbone Diagrams drive investigation and resolution, not just documentation. Teams identify contributing factors, assign actions, and track follow-through in one place. It’s structured RCA, applied in real time.
Here’s how operations and quality teams are using EviView to solve problems with speed and accountability:

EviView’s Digital Daily Management System has been transformative for Merck. By streamlining shift handovers, centralizing data, and integrating with SAP and Palantir Data Lake, we’ve reduced downtime by 30% and saved €66,000 annually. The system has boosted visibility, improved communication, and increased safety incident reporting by 300%, fostering a culture of continuous improvement and positioning us for long-term success.

Pharmaceutical Company, US
Head of Digitalisation and Strategy
I worked with EviView on an electronic handover project. Their team was very knowledgeable, took time to ensure all stakeholders were kept up to date with the progress of the project, and was always available to give advice on system usage during implementation.
Bio-Pharma Company, US
Manufacturing Team Lead
Karol's team delivered a highly successful change management and digital transformation project. His structured approach, detailed analysis, and process-driven methodology have been invaluable on every project. EviView's understanding of business, IT, operations, and budgetary needs is unmatched.
Top 5 Pharma Manufacturer, EU
Senior Manager of Engineering & Maintenance
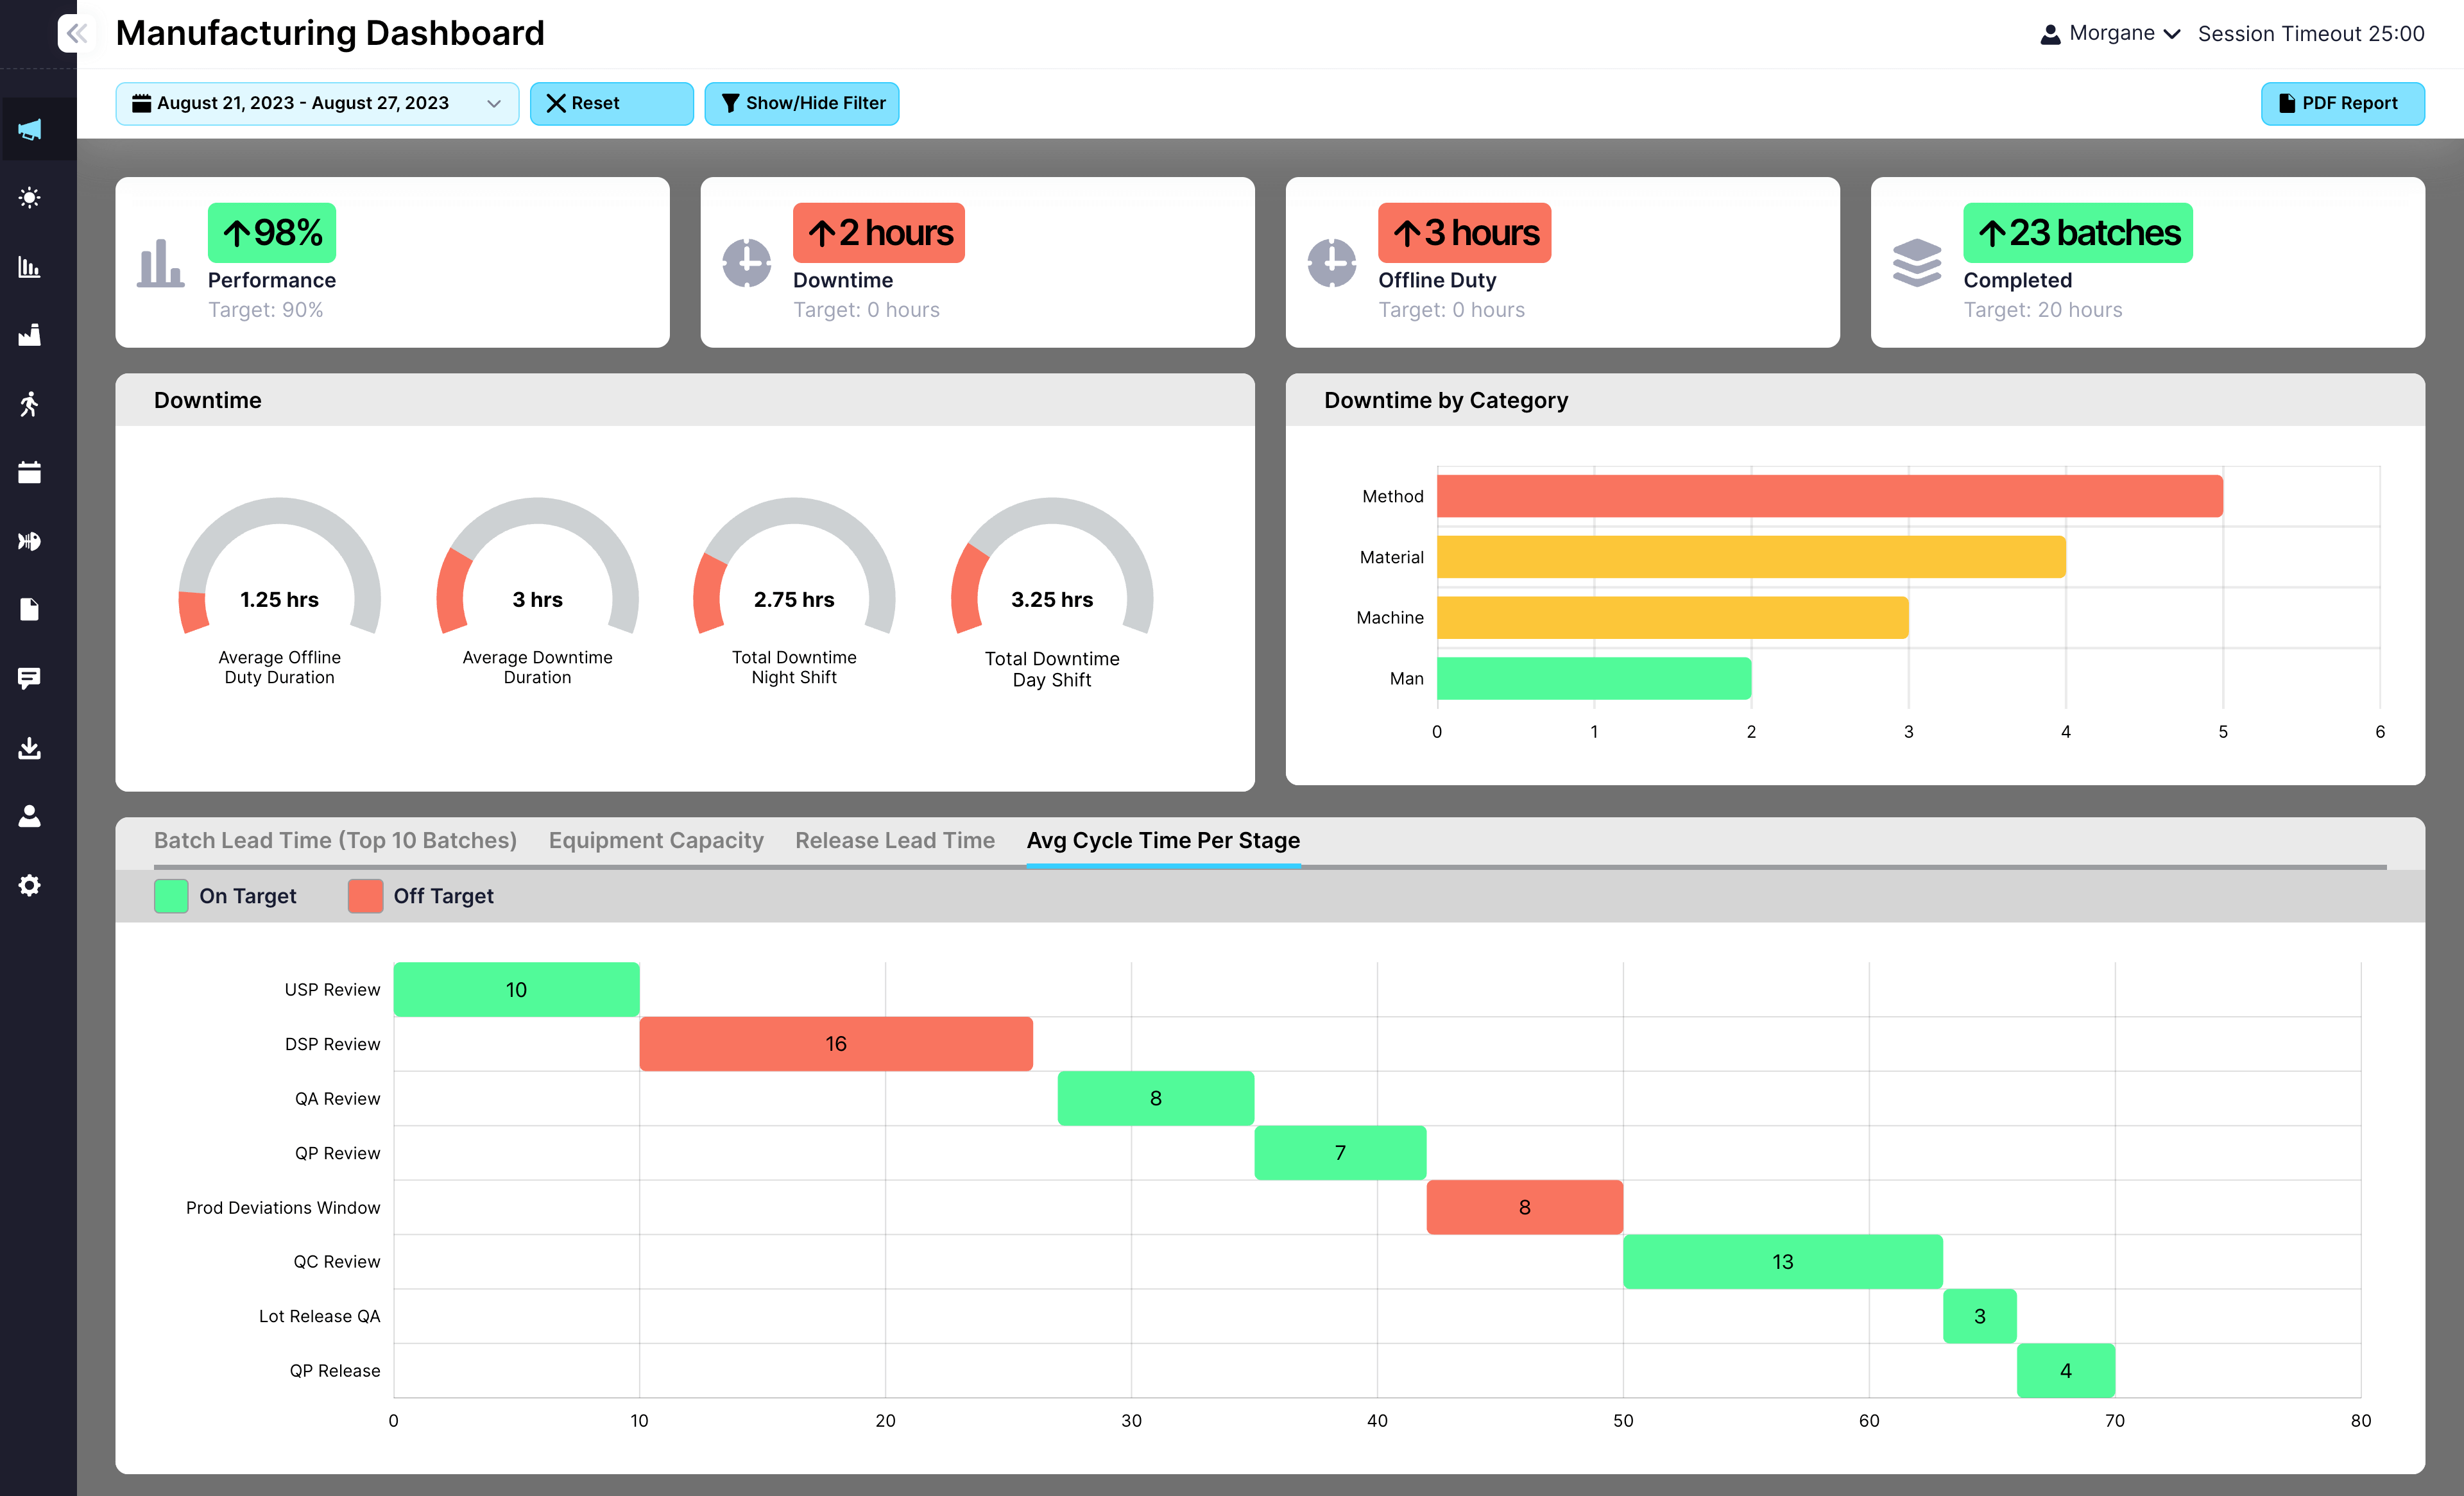
Fishbone diagrams in EviView don’t just capture causes, they generate data. As teams investigate and resolve issues, every step feeds live RCA dashboards. You get visibility into trends, bottlenecks, and resolution timelines—across shifts, teams, and sites. Make RCA measurable, actionable, and part of everyday performance review