
Beyond the Dashboard: How Digital Tierboards Transform from “Status Reports” to “Action Engines”
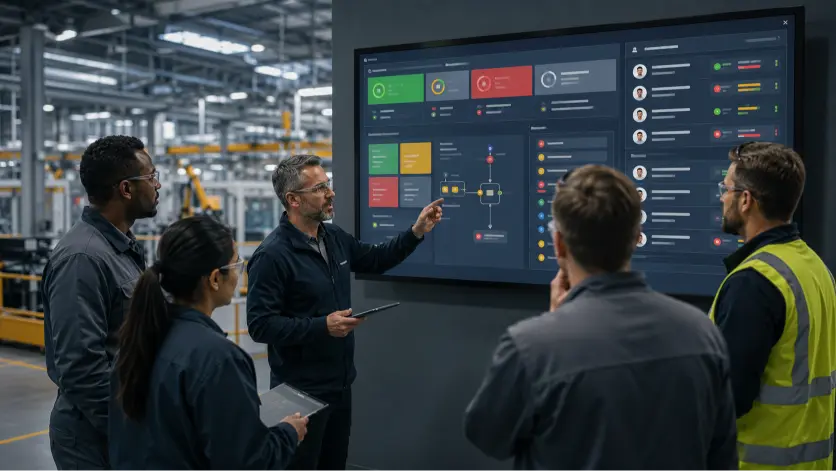
For Operations Directors, Plant Managers and CI Leaders who are tired of watching the same problems resurface in every morning meeting. Every Monday morning, somewhere in a manufacturing plant, a team gathers around a screen. The dashboard is pristine. Green, amber, red. Someone explains why last week’s OEE dipped to 68%. Actions are noted. The meeting ends. By Friday, half of those actions are still open – and next Monday, the same conversation begins again. This is not a data problem as you have more data than ever. This is a decision problem. And it’s costing you more than you think. Research from McKinsey shows that companies excelling at fast, high-quality decision-making are twice as likely to deliver returns of 20% or more – and the average Fortune 500 company loses an estimated $250 million annually to ineffective decision processes (source). Yet, most organizations keep adding data tools without fixing the decision architecture underneath them. According to Gartner, fewer than half of data and analytics leaders say their teams are effectively delivering business value, and analytics influence barely half of the decisions they’re supposed to inform. More data, more dashboards, and somehow, less action (source). The gap between knowing and doing is what separates a status report culture from an action engine culture. Digital tierboards, built and deployed correctly, are the mechanism that closes that gap. Here’s how. The Real Problem Isn’t a Lack of Data – It’s Decision Latency Let’s assume you’re running tiered daily management meetings: Tier 1 on the floor, Tier 2 with middle management, Tier 3 with senior leadership – you already know the theory. Cascade information up, drive accountability down, solve problems at the right level. The framework is simple… So why does it so often devolve into a status update ritual? The answer lies in what researchers call Decision Latency, the invisible interval between the moment an issue occurs and the moment someone commits resources to fix it. It is the gap between detection and action and in most organizations, this gap is neither measured nor managed (Gartner, 2026; McKinsey, 2024). In traditional manufacturing environments, the Decision Latency Index (DLI) can be 7 days or more. In digital-first organisations, it’s 1-3 days (The Agile Brand Guide, 2026). That gap represents days of waste, missed production windows, and compounding quality issues. “Adding more BI tools often increases latency rather than reducing it. Executives get more visibility but not more velocity. The result is decision friction – teams waiting for clarity rather than acting with courage.” – Karol Dabrowski, CEO at EviView The root cause is almost always the same: dashboards are built to report on the past, not to drive action in the present. When data arrives outside the cadence at which decisions are actually made, it doesn’t inform action … it just adds noise. The transition from dashboard-as-report to tierboard-as-engine requires a different architecture entirely. What Makes a Tierboard an “Action Engine”? A traditional dashboard answers the question: What happened? An action engine answers: What needs to happen right now, who owns it, and is it getting done? The distinction sounds simple, but the operational difference is significant. Here are the four characteristics that separate a status-report culture from an action-engine culture: 1. Exceptions Over Averages Most dashboards surface averages – last week’s OEE, this month’s downtime trend. Action engines surface exceptions – the machine that has failed three times this shift, the line where IPC completion is running 40 minutes behind, the safety near-miss that happened during the weekend handover. When your Tier 1 board highlights risks for the current shift before they escalate, you shift from reactive firefighting to anticipatory management. The question changes from “what went wrong?” to “what might go wrong in the next two hours?” 2. Decision-Ready Data Decision-ready data is information that allows an Operations Director to act before a problem compounds. It involves continuous data transformation, real-time visibility into task progress, and standardized insights that guide human decision-making without requiring a 30-minute data reconciliation exercise. The most effective tiered management systems follow a 40/20/40 rule: 40% of effort invested in preparation (sharing the right data before the meeting), 20% in the actual meeting (deciding and solving), and 40% in follow-up (tracking whether actions were completed). Most organisations invert this – spending 80% of their meeting time explaining data and almost nothing on structured follow-through. 3. Owner-Tagged Actions with Due Dates An action without an owner is a wish. A Tier 1 board that lists issues without assigning them to a named individual and a specific time for resolution will always drift toward status reporting. The physical or digital equivalent of “someone should look into this” is the single biggest contributor to the action gap. Effective tierboards make ownership visible and non-negotiable. When an escalation happens from Tier 1 to Tier 2, it carries a full audit trail: what the issue is, when it occurred, what was tried, and who owns resolution at the next level. 4. Structured Escalation Pathways Escalation is not a failure – it is a system. When an issue cannot be resolved at Tier 1, it should be documented and escalated to Tier 2 automatically and without friction. This ensures that problems don’t linger at the wrong level or fall through the cracks between shifts. The interconnected nature of a well-designed tiered structure creates a single source of truth from the shop floor to the boardroom, one that reflects reality in real time rather than in next week’s report. The Anatomy of a Tiered Management System That Actually Works For context, a well-functioning tiered management system typically operates across three or four levels: Tier 1: Frontline Staff & Team Leads: Daily/per-shift stand-ups (15 min). Focus: SQDP (Safety, Quality, Delivery, People). Outcome: Immediate countermeasures and owner-tagged actions.Tier 2: Middle Management & Support: Daily. Focus: Systems of work and cross-functional bottlenecks. Outcome: Resource allocation and escalation resolution.Tier 3: Senior Leadership: Weekly/Monthly.Focus: Strategic initiative progress.Outcome: Alignment between operational performance and business goals.Tier 4: Executive Committee: Monthly/Quarterly. Focus: