

What Is Leader Standard Work?
Leader standard work is a defined set of recurring checks and routines that managers carry out on a fixed cadence to keep a management system

What Is A3 Problem Solving?
A3 problem solving is a structured method for working through a problem on a single sheet of paper, moving from the current situation to a

What Is FMEA Analysis?
FMEA, short for failure mode and effects analysis, is a structured method for finding the ways a product or process could fail before it does,

What Is an Ishikawa Diagram?
An Ishikawa diagram is a cause and effect tool that sorts the possible causes of a problem into categories branching from a spine, named after

What Is a Fishbone Diagram?
A fishbone diagram is a visual tool for mapping the possible causes of a problem, grouping them into categories that branch off a central spine,

What Is Pareto Analysis?
Pareto analysis is a prioritisation technique that ranks problems, or their causes, by size, so effort goes to the few that cause most of the

What Is 8D Problem Solving?
8D problem solving is a structured method for working through a serious defect or complaint in eight defined disciplines, from assembling a team to stopping

What Is 5S in Lean Manufacturing?
5S is a lean manufacturing method for organising a workplace so that everything the work needs has a place, is easy to find, and stays

What Is Genchi Genbutsu?
Genchi genbutsu is the practice of going to the actual place to see the actual thing for yourself, rather than forming a judgement from a

What Is Production Monitoring?
Production monitoring is the continuous tracking of what a manufacturing line is producing while it runs, its output, rate, stoppages, and quality, measured against the
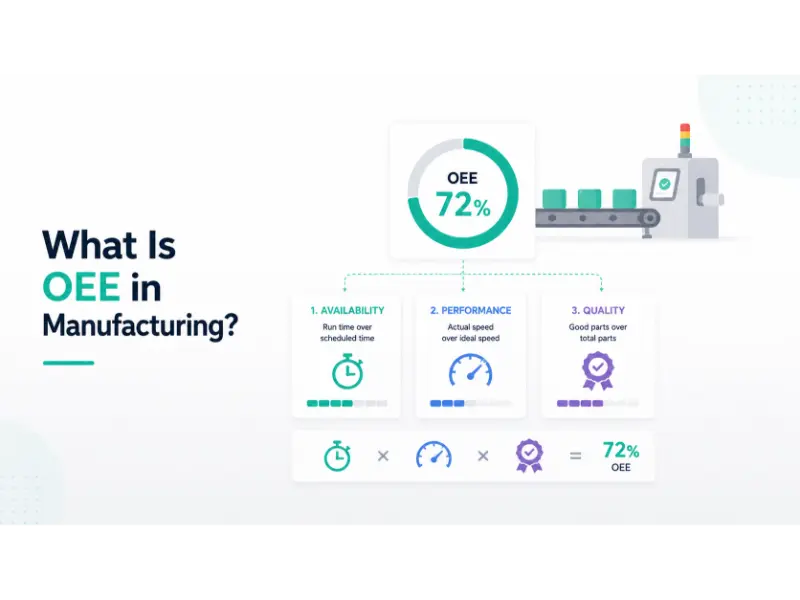
What Is OEE in Manufacturing?
OEE, or Overall Equipment Effectiveness, is the standard measure of how much of the time a machine was scheduled to make good parts it actually
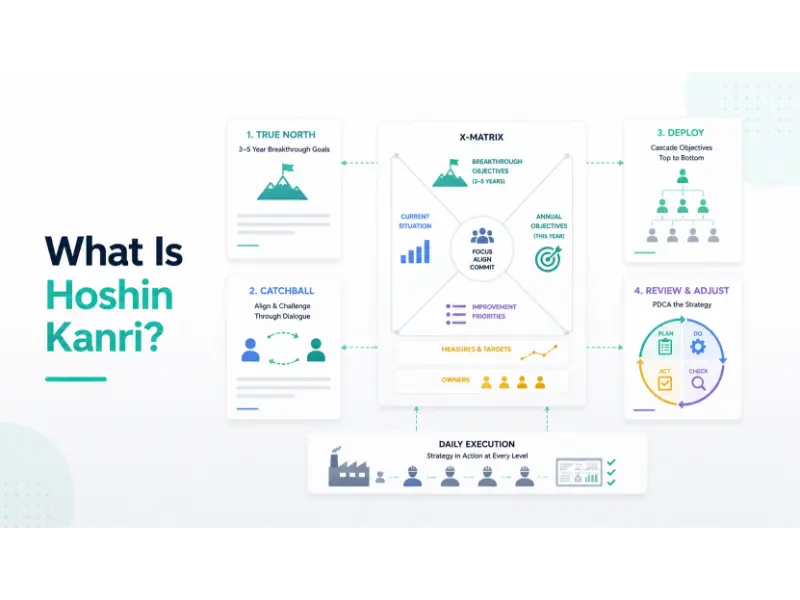
What Is Hoshin Kanri?
Hoshin Kanri is a strategic planning method that aligns an organisation’s few long-term breakthrough goals with the daily work of every level, by cascading objectives,
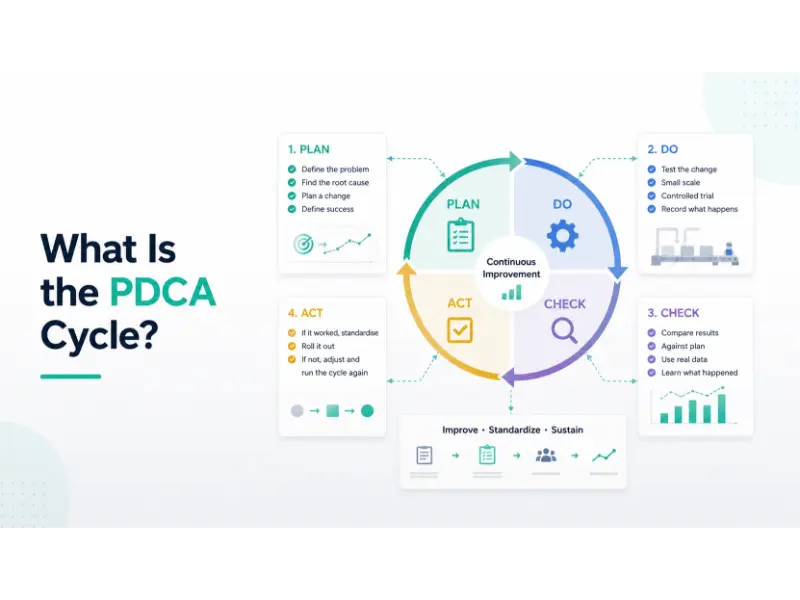
What Is the PDCA Cycle?
The PDCA cycle is a four-step method for improving a process by testing a change on a small scale before committing to it. Plan a
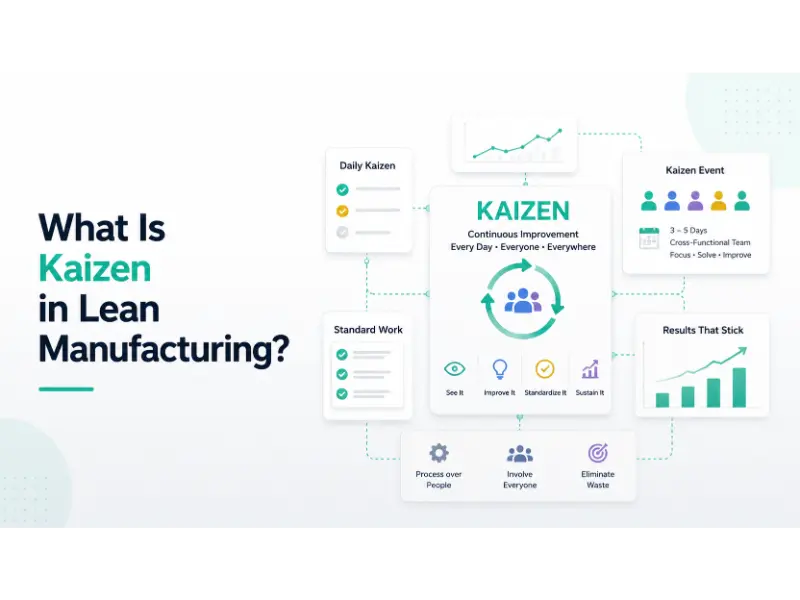
What Is Kaizen in Lean Manufacturing?
Kaizen is the Japanese practice of continuous improvement, and in lean manufacturing it means improving how work is done through small, steady changes made by
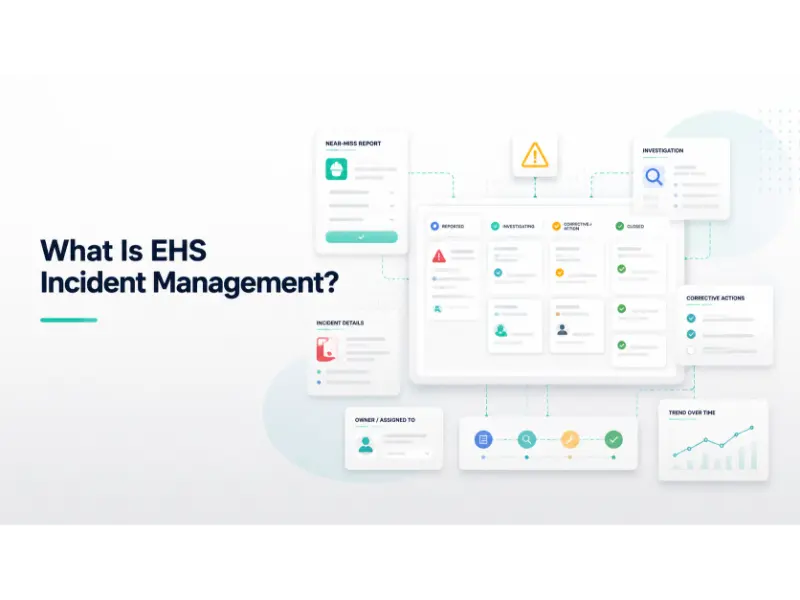
What Is EHS Incident Management?
EHS incident management is the process a manufacturer uses to capture, investigate, and resolve environment, health, and safety events, from near misses to injuries and
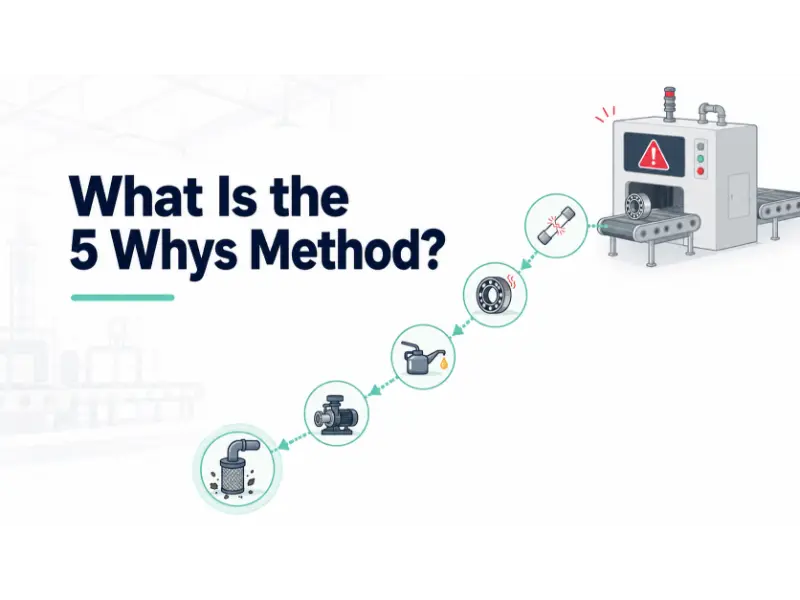
What Is the 5 Whys Method?
The 5 Whys method is a simple root cause analysis technique that works by asking “why” a problem happened over and over, usually about five
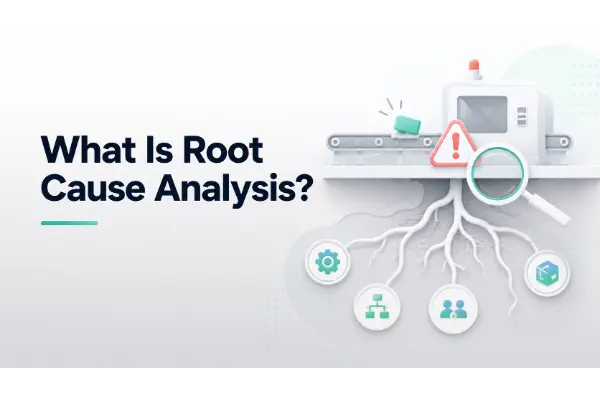
What Is Root Cause Analysis?
Root cause analysis, usually shortened to RCA, is a structured way of finding the real reason a problem happened, rather than the symptom sitting on
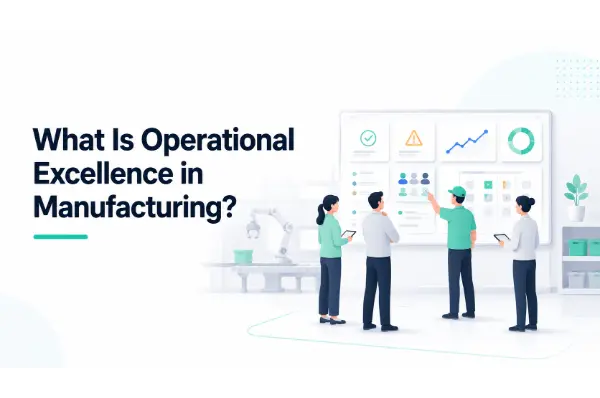
What Is Operational Excellence in Manufacturing?
Operational excellence in manufacturing is the state a site reaches when running well stops depending on a few heroes and becomes the way everyone works.
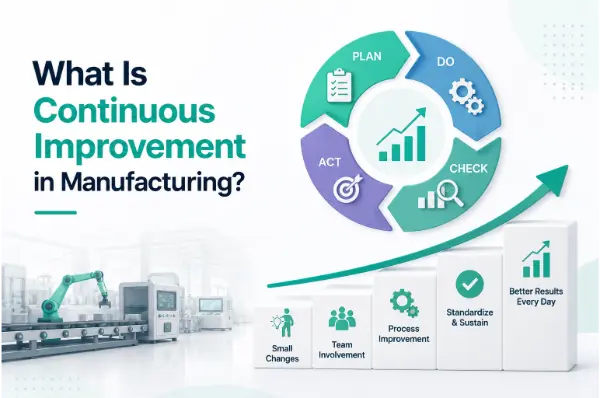
What Is Continuous Improvement in Manufacturing?
Continuous improvement in manufacturing is the practice of making small, steady changes to how a plant runs, instead of waiting for big one-off projects to
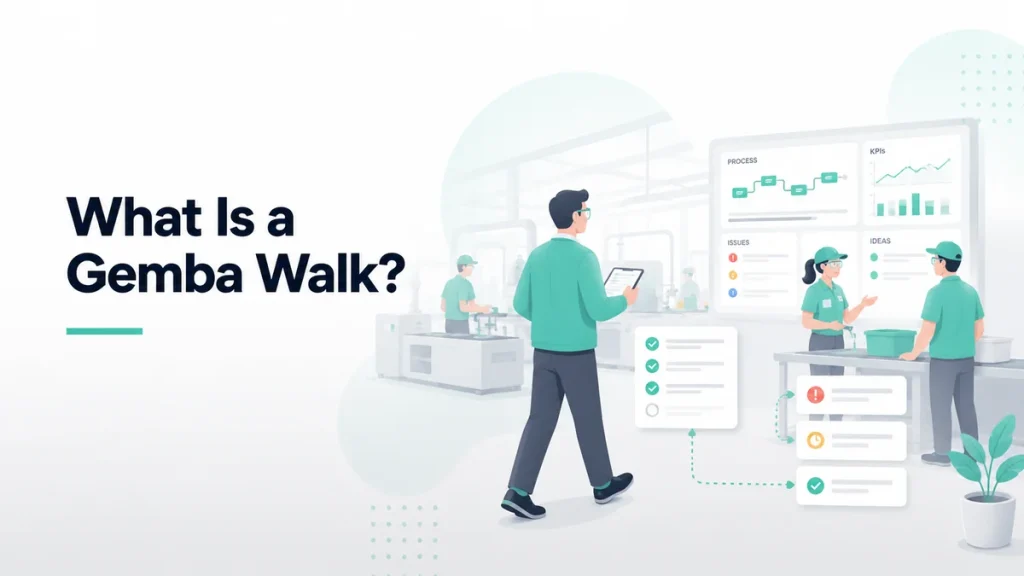
What Is a Gemba Walk?
A gemba walk is a structured visit to where work actually happens, the production line, the lab, the packing hall, where a manager observes the

What Is an SQDC Board | Eviview
An SQDC board is a visual management tool that tracks how a team is performing across four key areas: Safety, Quality, Delivery, and Cost. Each

What Is Obeya in Lean Manufacturing
Obeya (大部屋) is the Japanese word for “big room.” In lean manufacturing, an Obeya is a dedicated space where a cross-functional team gathers, surrounds themselves

What Is a Tier Board
A tier board is the visual surface a team uses to run their daily meeting. It’s where the numbers, problems, and actions for the day

What Is a Tier Meeting
A tier meeting is a short daily huddle where a team reviews how the last shift performed, what’s planned today, and any problems that need

What Is a Daily Management System in Manufacturing
A daily management system, often shortened to DMS, is the way a manufacturing team runs its operation day by day. It keeps everyone aligned on

What Is a Production Log
A production log is a written record of what a plant made, when it was made, and the conditions it was made under. It’s the

What Is a Shift Report
A shift report is a short summary that the outgoing shift writes at the end of their hours. It explains how the shift went, what

What Is a Shift Log in Manufacturing
A shift log is the running record of what happens during a production shift. What ran. What stopped. What got fixed. What the next team

What Is an Electronic Logbook
An electronic logbook, often shortened to eLogbook, is a software system used to record day-to-day activities and events in regulated industries. It does the job

What Is a Digital Logbook
A digital logbook is software that records what happens during operations, with every entry timestamped, attributed to a user, and stored where anyone with permission